Analyze Trufflehog findings! (feat. Elasticsearch & Grafana)
Why?
Have you ever wondered how many secrets you store in files in plain text? Malicious software that would scan your system could get to them and send them to some bad guys. Trufflehog can help you find those secrets.
TLDR; Trufflehog is a secret scanner.
What?
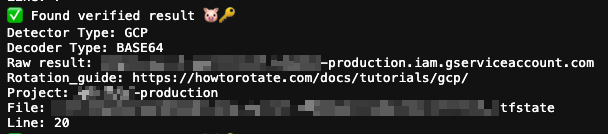
Trufflehog displays found secrets in the following format by default:
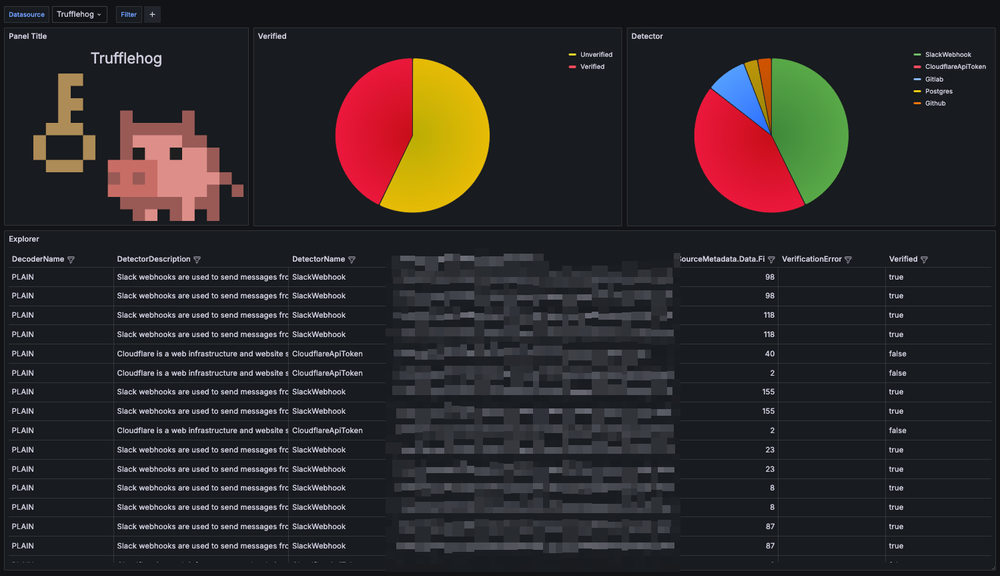
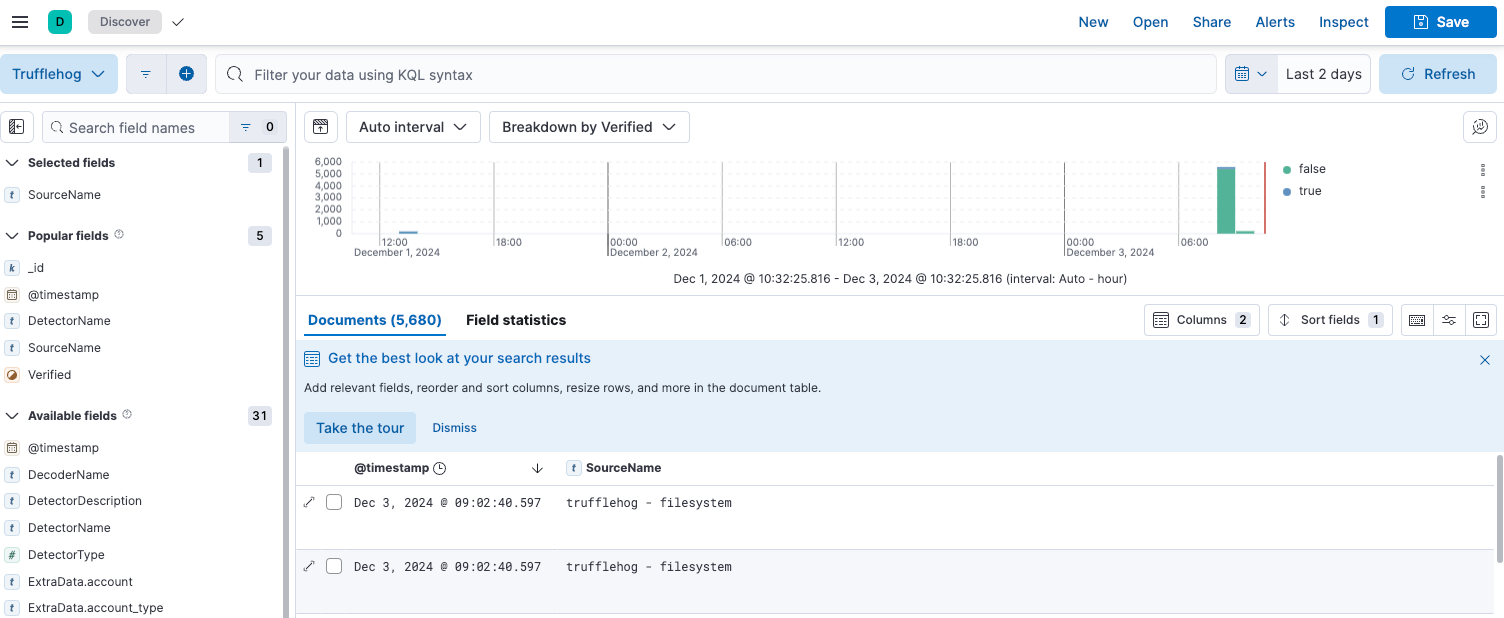
Perhaps that is sufficient if you have a small number of findings. However, if you have over 100 findings, it would be beneficial to visualize, filter, and search through those findings, as demonstrated in the following Grafana dashboard:
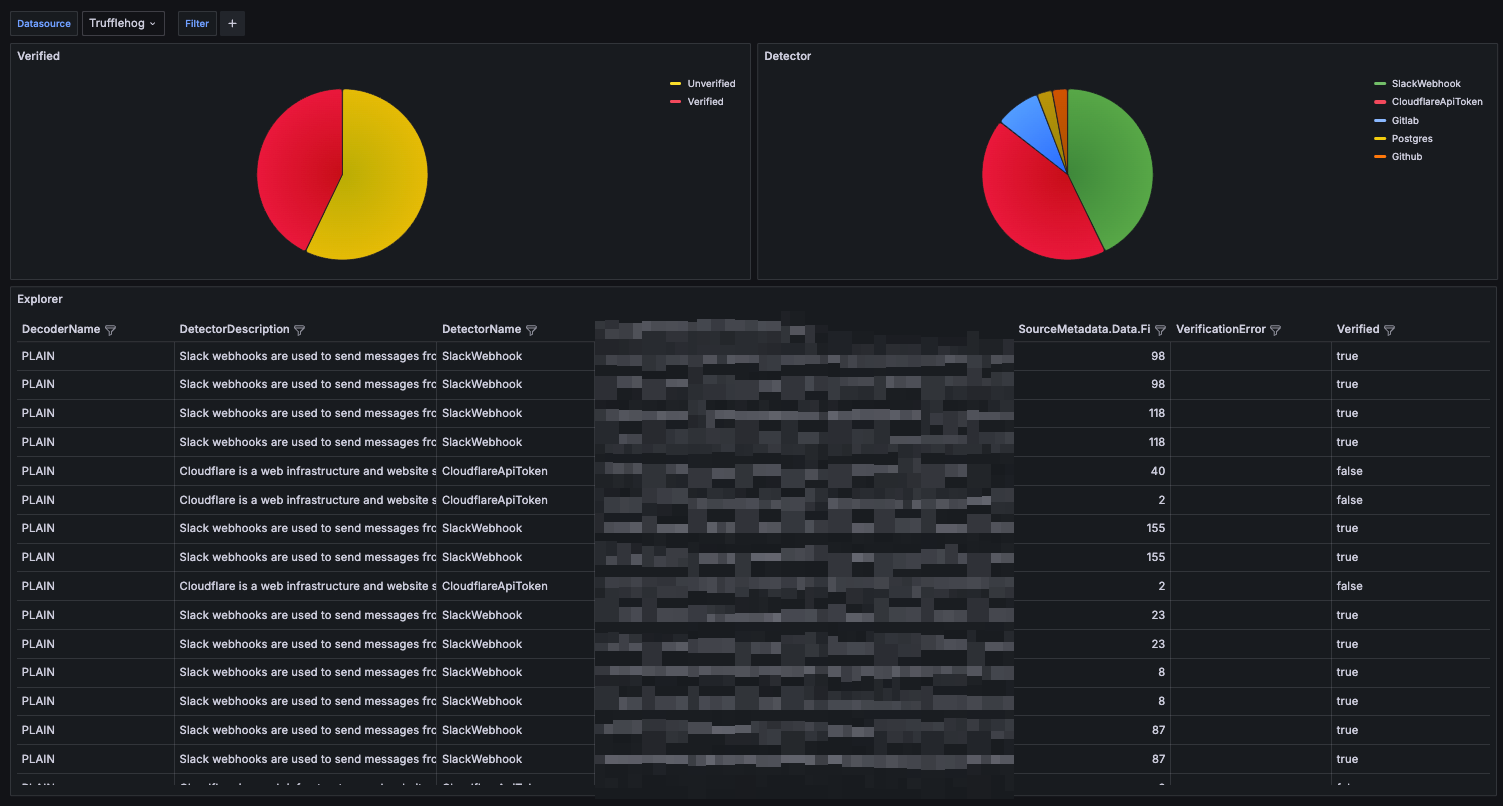
If you want to learn how to achieve this, continue the reading.
More info: https://trufflesecurity.com/blog/how-trufflehog-verifies-secrets
How?
Process
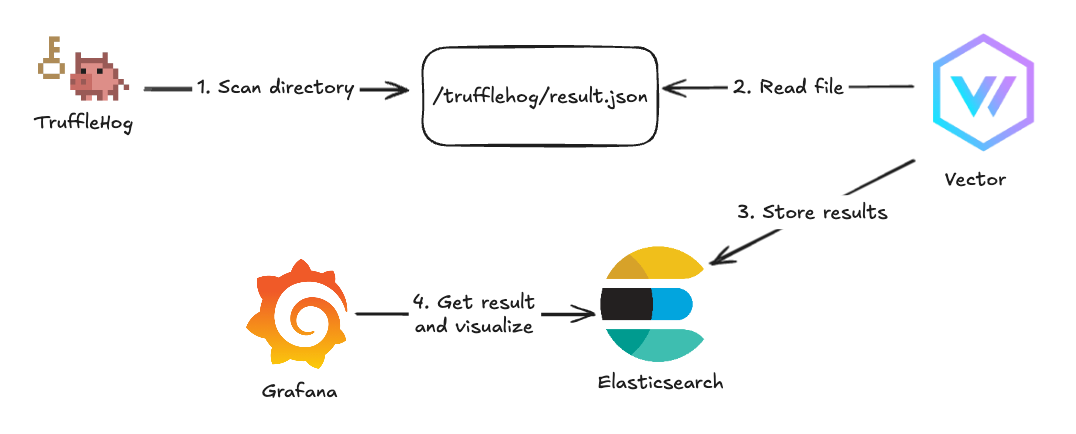
The process looks like this:
- Run TruffleHog scan with output JSON format and log output into the file
- Read the file with Vector and forward JSON documents to Elasticsearch
- Setup Grafana to use Elasticsearch as a data source
- Create Grafana dashboards
TruffleHog JSON output
You can select JSON output with --json flag. It will produce results in the following format:
{
    "SourceMetadata": {
        "Data": {
            "Filesystem": {
                "file": "<REDACTED>",
                "line": 1
            }
        }
    },
    "SourceID": 1,
    "SourceType": 15,
    "SourceName": "trufflehog - filesystem",
    "DetectorType": 8,
    "DetectorName": "Github",
    "DetectorDescription": "GitHub is a web-based platform used for version control and collaborative software development. GitHub tokens can be used to access and modify repositories and other resources.",
    "DecoderName": "PLAIN",
    "Verified": false,
    "Raw": "<REDACTED>",
    "RawV2": "",
    "Redacted": "",
    "ExtraData": {
        "rotation_guide": "https://howtorotate.com/docs/tutorials/github/",
        "version": "1"
    },
    "StructuredData": null
}
Run TruffleHog
To run TruffleHog scan for a directory:
trufflehog filesystem {{ .DIRECTORY }} --json \
--force-skip-binaries \
--force-skip-archives \
--concurrency=1 |\
tee -a /trufflehog/$(date +%Y-%m-%d-%H-%M-%S).json
Scan directory with Trufflehog, print output in JSON format and store in /trufflehog directory
tee will append new output to the file and Vector will proces it progressively.Some explanations for additional flags:
- scanning binaries and archives can produce A LOT of unverifiable results as there is a lot of entropy
- concurrency is minimized as some services like GitHub or AWS may rate limit or even block your IP when TruffleHog tries to verify a lot of found secrets
ETL
JSON formatted data can be stored in Elasticsearch, but it requires some enrichment (like adding @timestamp fields so Grafana can query that data).
Vector can read Trufflehog JSON output, parse it, and upload it to Elasticsearch (a DataDog open-source ETL tool).
But first, let's start Elasticsearch to store those results:
services:
  elasticsearch8:
    image: docker.elastic.co/elasticsearch/elasticsearch:8.15.1
    container_name: elasticsearch8
    environment:
      discovery.type: single-node
      ES_JAVA_OPTS: "-Xms512m -Xmx512m"
      ELASTIC_PASSWORD: elastic
      KIBANA_PASSWORD: kibana
      xpack.security.enabled: false
      xpack.security.http.ssl.enabled: false
      xpack.security.transport.ssl.enabled: false
    ports:
      - "9200:9200"
      - "9300:9300"
    volumes:
      - elastic_data:/usr/share/elasticsearch/data
    networks:
    - trufflehog
  kibana8:
    image: docker.elastic.co/kibana/kibana:8.15.1
    container_name: kibana8
    ports:
      - "5601:5601"
    depends_on:
      - elasticsearch8
    volumes:
    - kibana_data:/usr/share/kibana/data
    environment:
      ELASTICSEARCH_HOSTS: http://elasticsearch8:9200
      ELASTICSEARCH_PASSWORD: kibana
      ELASTICSEARCH_USERNAME: kibana_system
      xpack.security.enabled: false
      xpack.security.http.ssl.enabled: false
      xpack.security.transport.ssl.enabled: false
    networks:
    - trufflehog

networks:
  trufflehog: {}

volumes:
  elastic_data:
    driver: local
  kibana_data:
    driver: local
elasticsearch/docker-compose.yaml
To start: docker compose -f elasticsearch/docker-compose.yaml up -d
Now, let's configure Vector:
data_dir: /var/lib/vector

sources:
  file:
    type: file
    include:
    - /trufflehog/*.json

transforms:
  parse:
    type: remap
    inputs:
    - file
    source: |
      . = parse_json!(.message)

  add_timestamp:
    type: remap
    inputs:
    - parse
    source: |
      .@timestamp = now()

sinks:
  elastic:
    type: elasticsearch
    inputs:
    - add_timestamp
    endpoints:
    - "http://elasticsearch8:9200"
    auth:
      strategy: "basic"
      user: "elastic"
      password: "elastic"
    id_key: "_id"
    mode: "bulk"
    bulk:
      index: "trufflehog"
      action: create
Vector Configuration - vector.yaml
Now let's start Vector:
services:
  vector:
    container_name: vector-trufflehog
    image: timberio/vector:0.31.0-alpine
    volumes:
      - ./vector.yaml:/etc/vector/vector.yaml:ro
      - /trufflehog:/trufflehog
    command:
    - -c
    - /etc/vector/vector.yaml
    ports:
    - 8686
    networks:
    - trufflehog

networks:
  trufflehog:
    external: true
vector/docker-compose.yaml
with command: docker compose -f vector/docker-compose.yaml up -d
Verify
To check if all is running smoothly, go to http://localhost:5601 and log in with elastic/elastic and check if data is appended to trufflehog index.
If you see any data, then everything is fine.
Grafana
services:
  grafana:
    image: grafana/grafana:11.3.1
    container_name: grafana
    environment:
      GF_SECURITY_ADMIN_USER: admin
      GF_SECURITY_ADMIN_PASSWORD: admin
      GF_AUTH_ANONYMOUS_ENABLED: "true"
      GF_AUTH_ANONYMOUS_ORG_ROLE: Admin
    networks:
      - trufflehog
    ports:
      - 3000

networks:
  trufflehog:
    external: true
grafana/docker-compose.yaml
And start Grafana with docker compose -f grafana/docker-compose.yaml .
Add an Elasticsearch data source for the Trufflehog index like this:
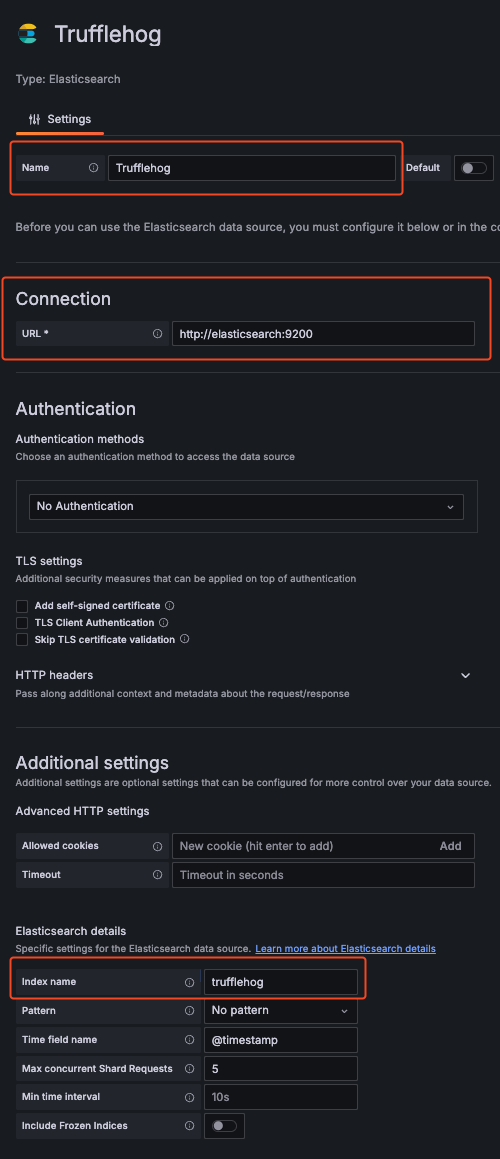
And import this Grafana dashboard:
https://grafana.com/grafana/dashboards/22459-trufflehog/
any data, then everything